In order to ensure participation in the ODA study for 2020, invitations were sent to 52 organizations that traditionally provide ongoing official development assistance in the health sector. Of these, only 11 organizations provided information about their projects in the health sector. We believe that this is due to the fact that during the pandemic period, many projects were frozen or official assistance was reallocated to fight the COVID-19 pandemic.
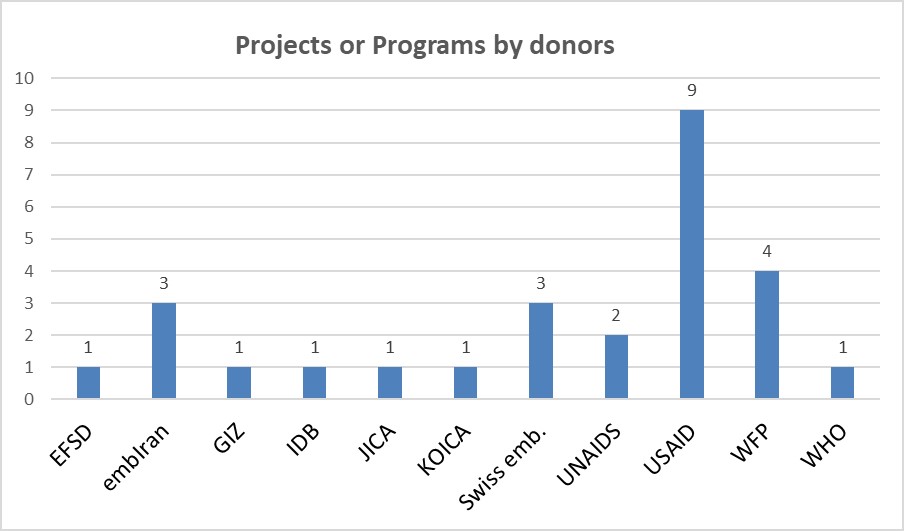
Figure 1. ODA projects or programs per donor, 2020
In terms of ODA allocated under bilateral and multilateral agreements, the United States of America (USAID) provided the most significant financial assistance to the Kyrgyz Republic. The United Nations World Food Program turned out to be the organization with the largest number of projects in 2020. The Embassy of the Islamic Republic of Iran and the Swiss Embassy are in third place with 3 projects each.
As shown in Figure 2 below, only 15 percent of the USD 15,537,153 was disbursed as concessional loans, while 85 percent was provided as grants. Which respectively amounted to US$ 3,000,000 and US$ 12,537,153 respectively.
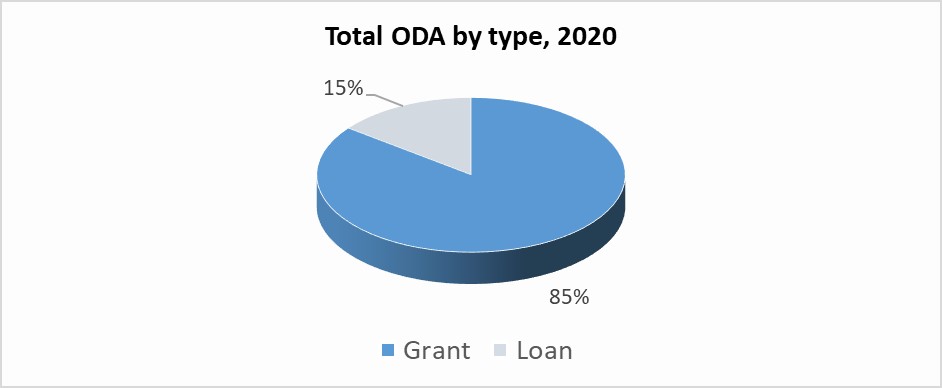
Figure 2. Total ODA by type
Regarding the distribution by funding category, the majority of funds in 2020 were allocated to Technical assistance (65.78%), 28.8% was allocated as Investments, and 5.4% for administrative costs related to the implementation of projects and programmes.
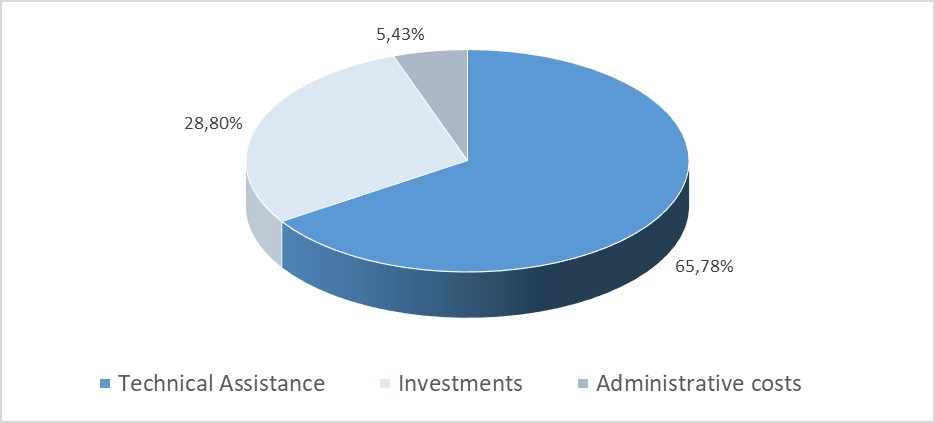
Figure 3. Total disbursements by funding category, 2020
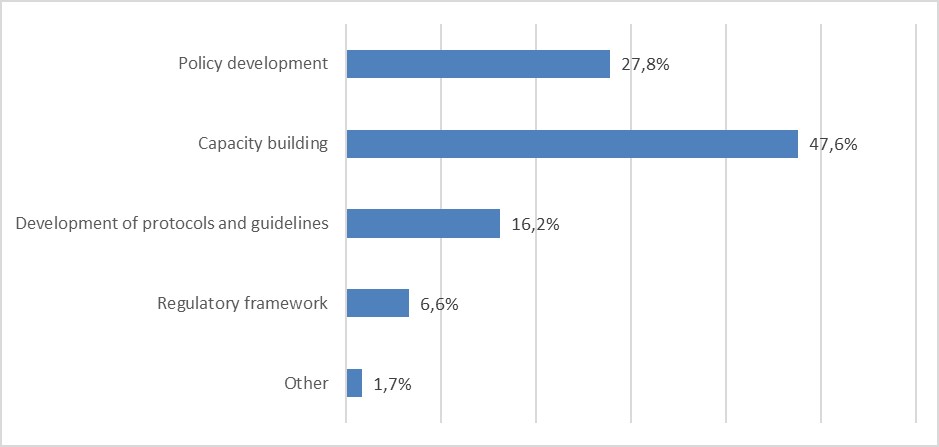
Figure 4. Technical Assistance by components, 2020
Most Technical Assistance funds were allocated to capacity building, which was particularly relevant during the pandemic (47.6%). 27.8% of Technical Assistance funds were allocated to policy development, nearly 16.2 % were allocated to the development of guidelines and protocols, and 6.6 % to the development of legal and regulatory frameworks.
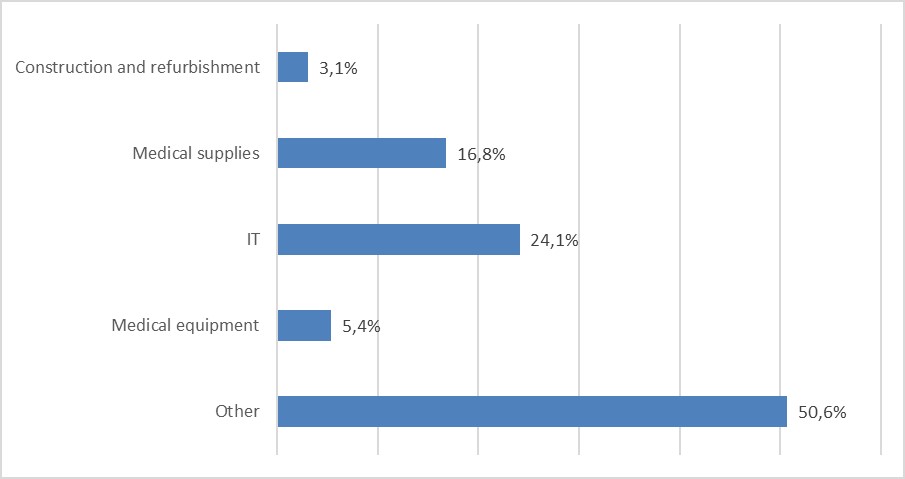
Figure 5. Investment funds by components, 2020
The investment component is distributed as follows: 3.1% was allocated to construction and refurbishment, while medical supplies and medical equipment accounted for 16.8% and 5.4%, respectively. 24. 1% was allocated to IT infrastructure development, which is much higher compared to previous years. The category with the most significant share of financing was "Other investments" - 50.6% of the total share of investment expenditures. One of the possible reasons for such a sharp increase in the share of other investments is the inclusion of a part of humanitarian aid in this component.
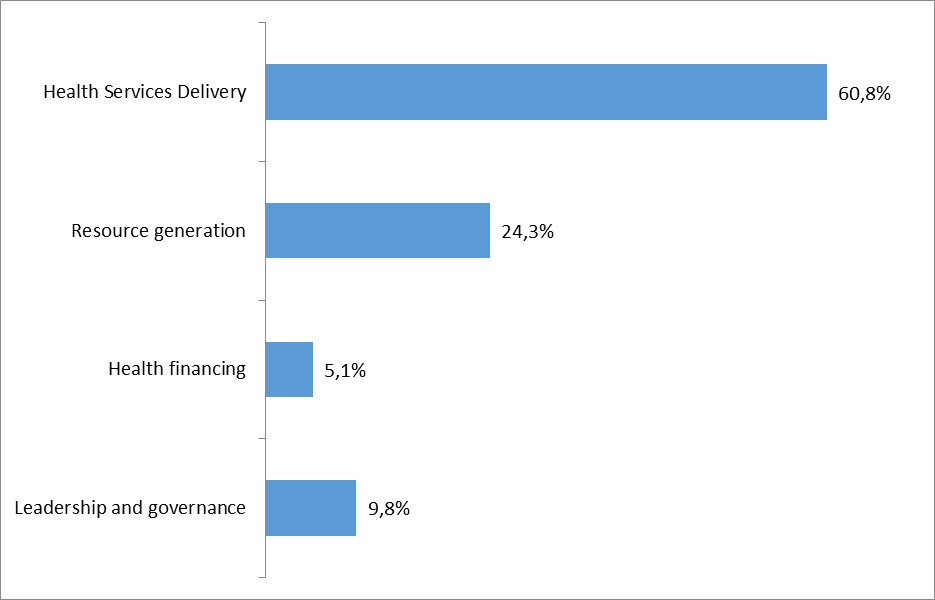
Figure 6. Disbursements by health system functions, 2020
Health service delivery was the main focus in 2020, with 60.8% of funds allocated there. According to the data presented, 24.3 % of the funds were allocated to resource generation, while 9.8 % were allocated to strategic leadership and governance of the health sector in 2020.
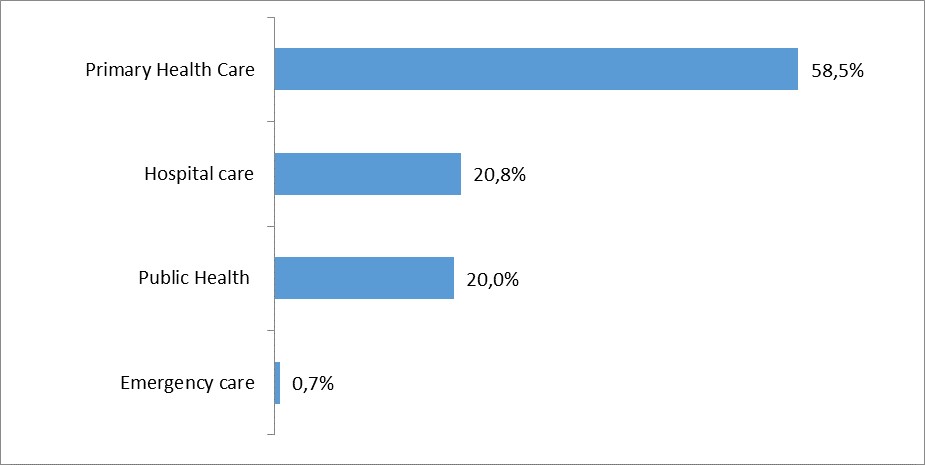
Figure 7. Distribution of health services delivery quota, 2020.
Regarding the distribution of the quota for the health service delivery, most of the funds in this category were allocated to the development of Primary Health Care - 58.5 percent. Development partners allocated 20.8% of funds to the development of hospital care. Public health services received slightly less - 20.0%.
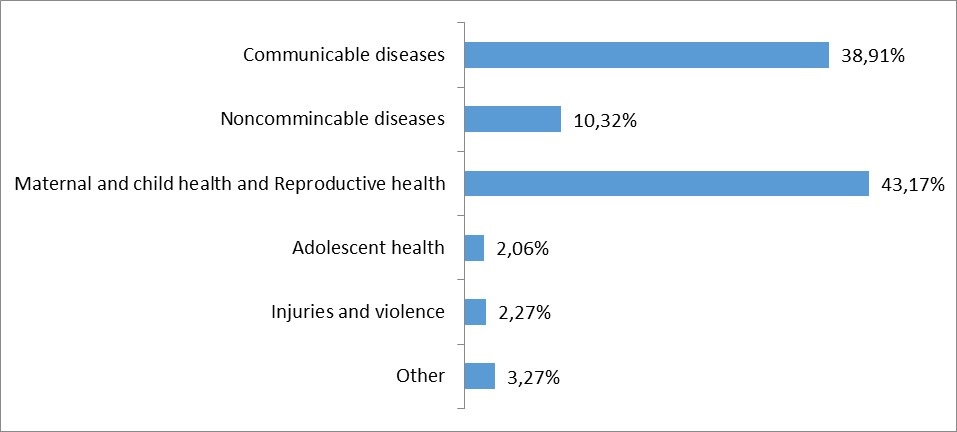
Figure 8. Distribution of ODA according to priority health areas, 2020
Development partners have been active in promoting maternal and child health - 43.17% of funds were allocated to this priority area. Control of noncommunicable and communicable diseases received 10.3 per cent and 38.9 per cent respectively. Partners participating in the study allocated only 2.06 % to adolescent health in 2020, and 2.2 % to injury and violence prevention. If these figures are compared with those for 2018-2019, the emphasis has shifted in favour of maternal and child health (8.92% in 2018).There has been a strong decrease in the share of noncommunicable diseases prevention from 20.46% in 2018 to 11.9% in 2020. This is because the fight against coronavirus infection has shifted the focus in favour of communicable diseases. Funding for communicable diseases as a percentage of funding has decreased with traditional donors, but a huge proportion is reflected in the humanitarian aid section.
Comparison of aid flows with health sector policies, strategies and programmes is indicated in the table: almost all interviewed development partners implement their projects taking into account the goals set out in the national strategies: the 2026 Development Programme of the Kyrgyz Republic, as well as the the Programme of the Government of the Kyrgyz Republic on health protection and health system development “Healthy person – prosperous country” for 2019-2030.
Table: Alignment of partners' activities with national priorities.
Table: Contribution of partners to the Sustainable Development Goals in 2020
Figure 9 below shows the number of missions and analytical work undertaken by health sector donors in 2020.
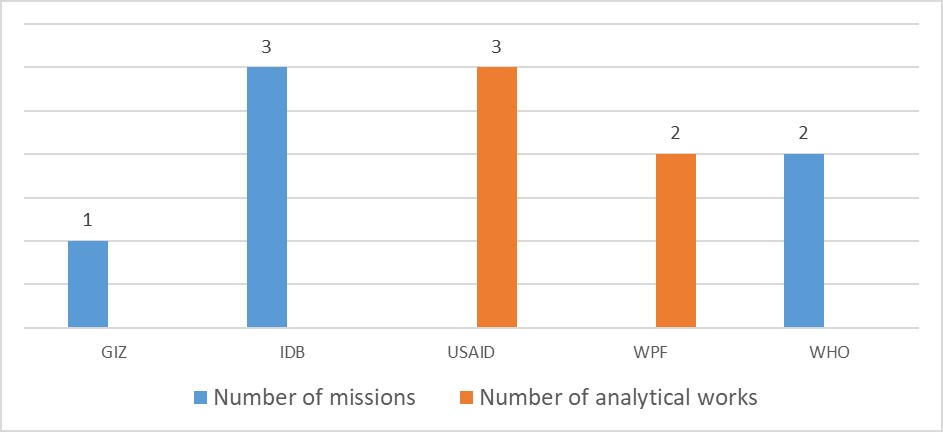
Figure 9. Missions and analytical work